
1. Introduction
Monitoring vegetation cover change is important for effective environmental and land-use planning, particularly in regions susceptible to agricultural expansion and human-induced degradation Forests cover nearly 80% of Võ Nhai District, encompassing production, protection, and special-use forests that are essential for biodiversity conservation, watershed regulation, and erosion control (People’s Committee of Võ Nhai District, 2025). Important ecosystem services that forest offer include carbon sequestration, water regulation, and assistance for local livelihoods, according to the Food and Agriculture Organization (FAO, 2020). Despite their importance, global assessments show that forest loss continues at alarming rates, primarily driven by agricultural expansion, infrastructure development, and unsustainable logging (Hansen et al., 2013; Curtis et al., 2018; Global Forest Watch, 2024).
Like other rapidly developing nations, Vietnam has seen substantial land use changes in recent decades. Despite their best efforts to balance development and conservation, national land use plans and forest policies have not always been able to stop deforestation and the fragmentation of natural vegetation (Ministry of Natural Resources and Environment, 2020). According to the Explanatory Report on the 2025 Land Use Plan of Võ Nhai District (People’s Committee of Võ Nhai District, 2025), agricultural land expansion, forestry development, and mineral exploitation remain key economic drivers. Northern regions like Thái Nguyên are particularly vulnerable to these challenges due to their reliance on agriculture, population expansion, and expanding road networks. According to Global Forest Watch (2024), Võ Nhai and Định Hóa together are made up 54% of Thái Nguyên's tree cover in 2010. Võ Nhai had the biggest area, with 66.2 thousand hectares.
Global Forest Watch (2024), further states that Thái Nguyên lost an estimated 79.4 thousand hectares (kha) of tree cover between 2001 and 2024, which is equal to 43% of its baseline forest area from 2000. This loss resulted in 70.5 million tonnes of CO₂ emissions and over a 20-year period, the humid primary forest within this area decreased by 7.19 kha, or 15%.
The district's forests are ecologically significant yet highly susceptible to threats such as cropland expansion, road construction, and timber harvesting. Data indicate a consistent decline in forest cover, with accelerated losses since the early 2000s according to Global Forest Watch, 2024. However, most existing research focuses on broader geographic scales, resulting in limited detailed, long-term analysis at the district level (Hansen et al., 2013; Curtis et al., 2018). Furthermore, few studies have integrated advanced techniques such as time-series disturbance detection and predictive modelling, which could provide a more comprehensive understanding of both historical changes and future risks (Kennedy et al., 2010; Kennedy et al., 2018; Shafizadeh-Moghadam and Helbich, 2015; Sang et al., 2021).

|
Figure 1. Study Area: Võ Nhai District, Thái Nguyên Province. |
2. Research methods
2.1 Location
Võ Nhai is a mountainous district in the northeastern part of Thái Nguyên Province, located along National Highway 1B between latitudes 21°36'–21°56' N and longitudes 105°45'–106°17' E. It shares borders with Na Rì district (Bắc Kạn Province) to the north, Bắc Sơn district (Lạng Sơn Province) to the east, Yên Thế district (Bắc Giang Province) to the south, and Đồng Hỷ district (Thái Nguyên Province) to the west and southwest.
The climate follows a northern tropical monsoon pattern, with a rainy season from April to October and a dry season from November to March. Mean annual temperature is approximately 22.4°C, peaking at 27.8°C in July. Rainfall averages about 1,941.5 mm annually, with more than 90% occurring during the rainy months (People’s Committee of Võ Nhai District, 2025).
In terms of land use and land cover, Võ Nhai District is dominated by forest, cropland, built-up areas, bare land, and water bodies, with forest historically representing the primary land-cover type. The study area includes the Thần Sa-Phượng Hoàng Nature Reserve, a protected area of high ecological importance known for its rich biodiversity, natural forest ecosystems, and karst landscapes. The presence of this nature reserve underscores the environmental and conservation significance of Võ Nhai District in northern Vietnam. However, according to reports from local authorities, the district has experienced a substantial decline in forest land over the past two decades, particularly since the early 2000s, driven by agricultural expansion, infrastructure development, and increasing human pressures. These contrasting characteristics high conservation value alongside rapid forest loss highlight the urgency of long-term vegetation monitoring and land-cover change analysis to support sustainable land-use planning and conservation management in the region.
2.2 Data Collection
Landsat images from 2000, 2010, and 2020 (Landsat 5 TM, Landsat 7 ETM+, and Landsat 8 OLI/TIRS) were acquired from the GEE archives duringthe dry season to minimize cloud contamination and phenological variability. Administrative boundaries and field data, were integrated for training and validation purposes.
2.3 Methodology
Google Earth Engine (GEE) for preprocessing, NBR calculation, LandTrendr segmentation, driver modification, statistical analysis. OpenStreetMaps (OSM) to retrieve river and roads data drivers. TerrSet (IDRISI) was used for CA–Markov predictive modeling. Finally, result was used ArcMap for cartographic presentation
Image Preprocessing
Cloud and shadow masking were applied using the Fmask algorithm available in GEE and surface reflectance products were used to correct atmospheric effects, ensuring consistency across years.
Time-Series Disturbance Detection
The temporal window was set from 2000 to 2025, corresponding to the study period. To minimize seasonal noise, images were constrained to the dry-season interval between October 20 and December 20 each year.
The LandTrendr algorithm was implemented in Google Earth Engine with the parameters listed in Table following those described by (Kennedy et al., 2018). Magnitude threshold (>300): Only changes with spectral differences above 200 NBR units were retained, filtering out minor fluctuations. Duration (<2years): Short-term disturbance events lasting less than four years were emphasized. Prevalence (>300): Pixels with stable pre-change values greater than 300 NBR were required, ensuring sufficient vegetation cover prior to disturbance. Minimum mapping unit (11 pixels): Small, isolated detections were removed to reduce classification noise.
|
Table 1. Landtrendr Parameters (Kennedy et al., 2018)
|
Code and documentation for the LT-GEE implementation can be found at https://github.com/eMapR/LT-GEE).
Land Cover Classification
Supervised land cover classification was performed for the years 2000, 2010, and 2025 using three machine-learning algorithms: Random Forest (RF), Support Vector Machines (SVM), and Classification and Regression Trees (CART) implemented in Google Earth Engine. These algorithms were selected because they are among the most widely applied and well-established classifiers in remote sensing studies of land cover and vegetation change, and they represent different modeling philosophies and levels of complexity (Pal & Mather, 2003; Mountrakis et al., 2011; Belgiu & Drăguţ, 2016). CART is a decision-tree-based method that is computationally efficient and easy to interpret but can be sensitive to noise and overfitting in heterogeneous landscapes (Pal & Mather, 2003). SVM is a margin-based classifier that performs well with high-dimensional and nonlinearly separable data, particularly when training samples are limited (Mountrakis et al., 2011). RF is an ensemble learning approach that integrates multiple decision trees and has been shown to provide high classification accuracy, robustness to multicollinearity, and resistance to overfitting in land cover mapping applications (Belgiu & Drăguţ, 2016).
The use of multiple classification algorithms allowed for a comparative assessment of classification performance and ensured that the final land cover products were derived from the most reliable method for the heterogeneous mountainous environment of Võ Nhai District. Classification accuracy was evaluated using standard confusion matrix metrics, including Overall Accuracy, Producer’s Accuracy, User’s Accuracy, and the Kappa coefficient. Based on this comparative evaluation, Random Forest consistently outperformed SVM and CART across all study years and was therefore selected as the final algorithm for producing the land cover maps used in subsequent analyses and predictive modeling.
The Landsat imagery was constrained to specific seasonal windows to minimize cloud cover and seasonal variability in vegetation phenology: August–December 2000 (2000-08-01 to 2000-12-31), October–December 2010 (2010-10-01 to 2010-12-31), and January–March 2025 (2025-01-01 to 2025-03-31). These periods correspond to relatively cloud-free conditions and stable vegetation states, thereby improving classification reliability (Zhu & Woodcock, 2014).
Training samples representing five land-cover classes forest, cropland, built-up area, bare land, and water bodies were manually digitized in Google Earth Engine using polygon, rectangle, and line drawing tools. Sampling focused on homogeneous land-cover features consistent with the 30 m spatial resolution of the Landsat imagery. Reference samples were spatially distributed across the study area to capture landscape heterogeneity while minimizing spatial bias. To reduce spectral mixing effects, all samples were selected from the interior of clearly defined land-cover units. A stratified random sampling strategy was applied to ensure balanced representation of all land-cover classes. For each study year, the reference dataset was divided into training and validation subsets using a 70:30 ratio. In total, 639 samples were collected for 2000 (496 for training and 143 for validation), 396 samples for 2010 (303 for training and 93 for validation), and 540 samples for 2025 (415 for training and 125 for validation).
Accuracy was assessed using confusion matrix, error matrices including Overall Accuracy (OA), Producer’s Accuracy (PA), User’s Accuracy (UA), and the Kappa coefficient (κ).Random Forest was chosen as map final land cover due to its high accuracy compared to the other classification methods
Land Cover Transition Modeling Using CA–Markov
The Markov transition probability matrix (P) was derived from land cover maps classified for 2000 and 2010 to quantify transition probabilities during the 2000–2010 period. These probabilities were used within the Cellular Automata–Markov (CA–Markov) framework to simulate land cover change. Model validation was performed by applying the 2000–2010 transition matrix to predict land cover for 2025 and comparing the simulated map with the observed 2025 classification using pixel-based cross-tabulation. Following validation, the calibrated model was used to project land cover changes to 2050.
CA–Markov and Regression modeling were combined to produced predicted landcover maps by 2050 in TerrSet
General logistic regression model for land-cover transition

Land cover maps for the 2000 and 2010 were used to predict land cover for 2025 which was used for validation the accuracy of the predictive model was assessed using a cross-tabulation approach, in which the land cover for 2025 was used for compared against the predicted land cover map for the same year. Pixel-by-pixel cross-tabulation quantified the degree of spatial agreement between predicted and actual land cover classes.
3. Results and Discusion
3.1 Time-Series Disturbance Detection
The LandTrendr analysis by Kennedy et al., (2018) was successful in capturing temporal disturbance dynamics in Võ Nhai The period 2001–2005 recorded the largest share of disturbed pixels (46.4%) shown in Figure 2(c) year of disturbance map, corresponding with an initial decline in NBR values during the early 2000s as illustrated in Figure 2(b) after forest mask. In contrast, Figure 2(a) fails to clearly show the early drop in NBR values or later changes due to interference from non-forest land cover types. This supports Kennedy’s theory that applying a forest mask is essential to avoid false disturbance detection. The reduced disturbance activity in 2006–2011 is reflected in relatively stable NBR levels during this interval. However, the surge of disturbances during 2012–2018 coincides with the sharp drop in NBR detected around 2013 and 2024 which can be attributed to intensified forest conversion driven by agricultural expansion, increased accessibility following road development, and selective logging in lowland and peri-upland areas. The renewed wave of disturbance pixels (18.3%) in 2019–2025 explains the steep downward trend in NBR values after 2021. These results are consistent with the Hansen et al. (2013) Global Forest Change dataset, which similarly identified concentrated forest loss in the early 2000s followed by recurrent disturbance events in subsequent decades. This confirms that the temporal clustering of disturbance events is a key driver of the district’s vegetation degradation trajectory. Following this drop, partial signs of recovery are observed during 2014–2015 and again in 2017–2018, where NBR values temporarily increased, indicating vegetation regrowth or stabilization. However, these recoveries were short-lived and did not return to pre-disturbance levels. After 2019, the trend shows renewed declines, culminating in further reduction after 2021.
NBR time-series revealed a persistent downward trajectory in forest health, with disturbances peaking between 2001–2005 and continuing through the following decades.
|
Figure 2. Time series NBR (a). before forest mask (b). after forest mask. |

3.1.1 Duration
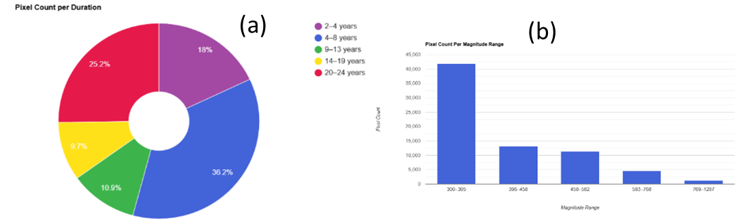
The disturbance duration analysis highlighted in Figure 3 and Figure 4 revealed that short-term disturbances were dominant. Disturbances lasting 2–4 years accounted for 17.9%, while those lasting 4–8 years contributed 36.1%. Combined, short-term disturbances represented more than 54% of the total. Intermediate durations (9–13 years: 10.9%; 14–19 years: 9.7%) were less common, whereas long-term disturbances (20–24 years) still accounted for a substantial 25.2% of the total.
The dominance of short-term disturbances suggests that vegetation change in the study area is mainly driven by temporary land-use activities followed by regeneration, indicating relatively strong vegetation resilience (Kennedy et al., 2010). However, the notable proportion of long-term disturbances points to persistent vegetation loss linked to permanent land-use conversion and forest degradation (Hansen et al., 2013), highlighting the need for targeted forest management and restoration efforts.
|
Figure 3. Disturbance maps showing year of disturbance, magnitude and duration. |

|
Figure 4. The duration of disturbance (a) Pixel count per duration range; (b) Pixel count per magnitude range. |
3.1.2 Magnitude
As shown in Figure 3 and Table 2, most disturbances fall within the low to moderate magnitude categories (300–458 units), representing approximately 76% of all affected area. These widespread moderate disturbances explain the gradual but consistent decline of NBR values across the district, as small-scale and repeated canopy losses accumulate over time
|
Table 2. Disturbance Magnitude
|
|
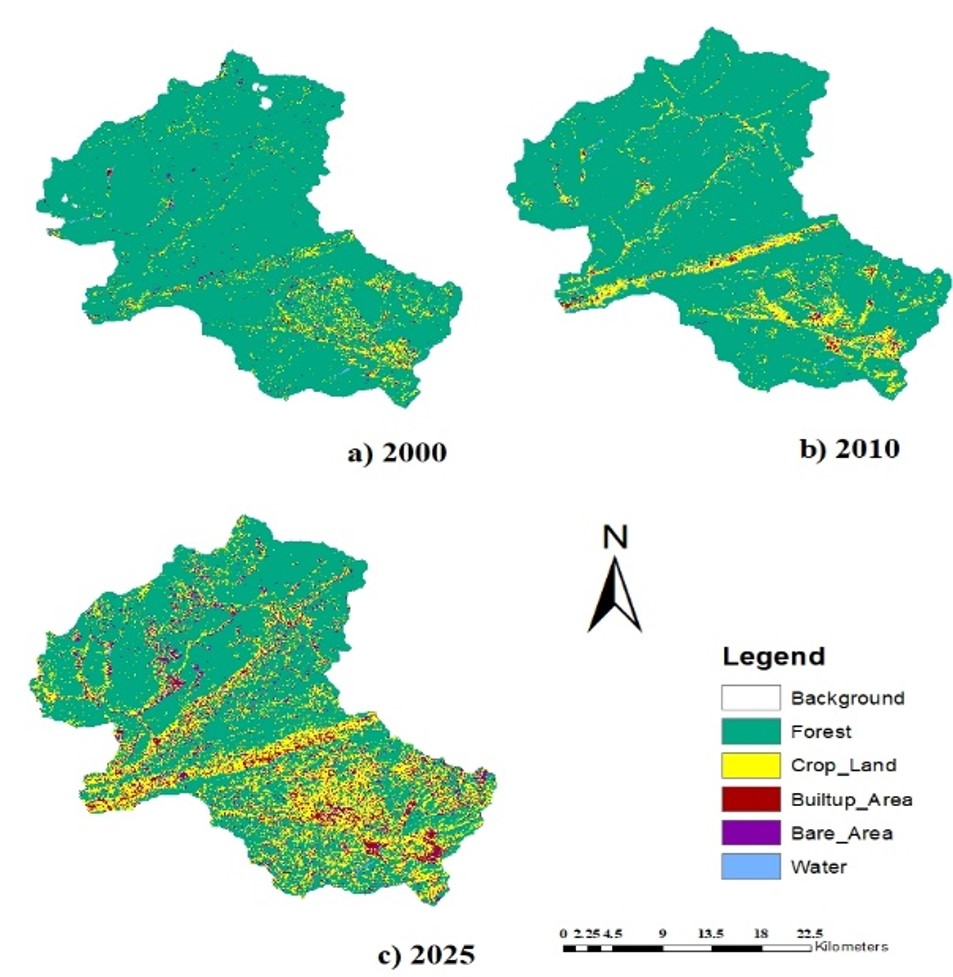
Figure 5. Landcover maps for year (a) 2000, (b) 2010 and (c) 2025. |
3.2 Temporal Land Cover Classification
The overall accuracies were 98, 95 and 88% for the years 2000, 2010, and 2025, respectively for Random Forest. The corresponding Kappa indices for the classification results in 2000, 2010, and 2020 were 0.92, 0.98, and 0.84, respectively thereby resulting in RF being selected as the final classification method.
Forest cover decreased substantially from 77,246.46ha in 2000 to 75,453.35ha in 2010, and further down to 53,522.33ha in 2025. This represents a loss of nearly 23,724ha (about 31%) whilst cropland expanded dramatically, from 4,501.06ha in 2000 to 6,679.44ha in 2010, and further to 20,620.58ha in 2025.
At the commune level, the results highlight significant variability in the extent of forest loss. The greatest proportional declines occurred in Tràng Xá (–59.0%), La Hiên (–58.3%), and Bình Long (–50.6%), where over half of the forest cover was lost during the study period. Moderate to high losses were also recorded in Dân Tiến (–46.4%), Đình Cả (–46.5%), and Phương Giao (–44.6%). By contrast, Thần Sa (–13.4%) and Sảng Mộc (–14.2%) displayed relatively lower reductions, though still representing significant losses in absolute terms.
RF model was used to the produce the classified image results (after classification processing) shown in Figure 4. The overall accuracies were 98%, 95% and 88% for the years 2000, 2010, and 2025, respectively. The corresponding Kappa indices for the classification results in 2000, 2010, and 2020 were 0.92, 0.98, and 0.84, respectively. Thus, while overall accuracy exceeded 0.85, the lower accuracy in 2025 can be attributed to the partly to increased land cover fragmentation and spectral similarity between bare area, built up area, and cropland areas, which made class separation more challenging.
|
Table 3. Forest Changed Per Commune in Vo Nhai District (2000-2025)
|
||||||||||||||||||||||||||||||||||||||||||||||||||||||||||||||||||||||||||||||||||||||||||||||||||||||||||
Forest cover decreased substantially with a loss of nearly 23,724ha (about 31%) whilst cropland expanded dramatically, from 4,501.06 ha in 2000 to 6,679.44ha in 2010, and further to 20,620.58ha in 2025. from 77,246.46ha in 2000 to 75,453.35ha in 2010, and further down to 53,522.33ha in 2025. At the provincial scale, Global Forest Watch (2024) reported that Thái Nguyên lost 79.4ha of tree cover between 2001 and 2024 (43% of its baseline forest area), with Võ Nhai identified as the leading hotspot of loss and indicating forest loss of 20.1 from 2001 to 2024.
3.3 Spatial Trend Change Analysis of Transitions
|
Figure 6. Spatial Trend Change Analysis of Transitions (a) Forest to Crop; (b) Forest to Built-up area; and (c) Forest to Bare area |
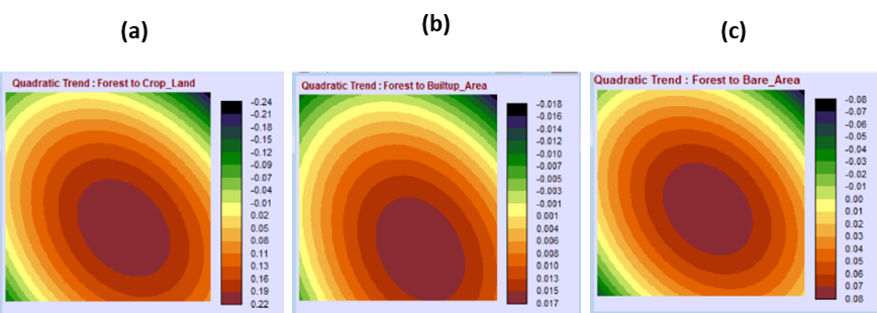
The quadratic surface in Figure 6(a) shows a curved southeastward trend, with the strongest forest-to-cropland transitions clustering in the southern and southeastern communes e.g., Bình Long, La Hiên, Tràng Xá suggesting that lowland areas with road access have been the primary drivers of agricultural expansion. Upland zones are generally characterized by steeper slopes, fragile soils, and limited access to irrigation there most agriculture is done in lowland areas (Ziegler et al., 2012)
The trend of change for forest-to-built-up transitions Figure 6(b) is in the eastern–western regions. This reflects settlement growth radiating outward from infrastructure hubs.
The quadratic surface Figure 6(c) shows a northwest–southeast curved gradient. Combined with the land cover in 2025 Figure 4. it shows that there is higher bare-land conversion in the northern uplands for example Sảng Mộc, Thần Sa, Cúc Đường. Comparable studies in northern Vietnam confirm these dynamics. Le et al. (2020) found that upland districts in Thái Nguyên and Bắc Kạn experienced higher rates of bare-soil exposure than lowlands, largely due to steep terrain and poor regeneration capacity after logging.
3.4 Predicted Land Cover of Võ Nhai District By 2050
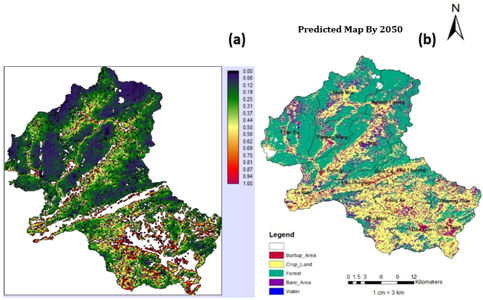
The projection highlighted in Figure 6(a) shows that land cover changes are most likely to occur in accessible lowland areas, particularly near settlements and transportation networks, whereas remote and higher-elevation forested areas remain comparatively stable.
|
Figure 7. Predicted land cover (a) Projected potential; (b) Predicted land cover map |
|
Table 4. Change in Forest by 2050
|
||||||||||||||||||||||||||||||||||||||||||||||||||||||||||||||||||||||||||||||||||||||||||||||||||||||||||
The disaggregated results by commune (Figure 6 and Table 4) show uneven forest distribution and loss across Võ Nhai. For example, Sảng Mộc (5,875.15ha) and Thần Sa (7,096.71ha) retain relatively large forest areas in 2025, while smaller communes such as Đình Cả (343.07ha) and Bình Long (349.78ha) retain only remnants of forest cover.
The projected changes to 2050 highlight the severity of these declines. For instance, Liên Minh in Table 4 is expected to lose 74.2% of its forest cover, dropping from 4,464 ha in 2025 to only 1,150 ha by 2050. Similarly, La Hiên is projected to lose nearly 59% of its forest by 2050. This suggests that certain communes will be disproportionately affected, particularly those located in accessible lowland zones where agricultural expansion is likely to be most intense.
|
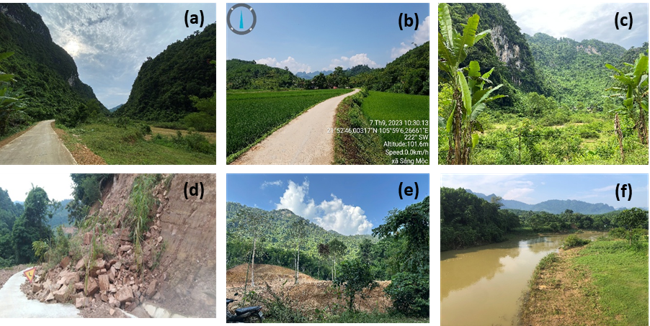
Figure 8. Field Observation of Land Cover Transitions and Spatial Patterns of Change Drivers: (a) Upland and Mountainous Zones; (b) Agriculture in low land area; (c) Dense Forest in mounts and shallow forest in valleys mixed with plantations; (d) Bare area in Upland and Mountainous Zones; (e) Bare area around the edges of upland and Mountainous Zones; (f) Shallow vegetation along river |
3.5 Validation of Prediction
The validation results yielded a Chi-square statistic of 2,256,096.75 (df = 25, p < 0.001), indicating that the observed agreement between predicted and actual land cover distributions was highly significant. The strength of association, measured by Cramer’s V (0.5007), suggests a moderate level of correspondence between model predictions and observed outcomes. These findings confirm that the CA–Markov model captured key land cover transitions and spatial dynamics, although some discrepancies remain due to the complexity of landscape processes.
The proportional cross-tabulation further supported these findings, with the model achieving an overall agreement of 81.8% and an overall Kappa coefficient of 0.74, indicating a moderate association between the predicted and observed maps. These findings align with comparable CA–Markov applications in tropical landscapes, which typically achieve 70–85% predictive accuracy and consistently forecast continued forest contraction under agricultural and infrastructural pressures (Sang et al., 2021; Eastman, 2016). For instance, Sang et al. (2021) applied CA–Markov modeling in central Vietnam and predicted substantial deforestation in lowland and peri-urban areas, underscoring the model’s reliability in detecting spatially explicit risk zones. Similarly, Shafizadeh-Moghadam & Helbich (2015) found CA–Markov to be effective in predicting deforestation hotspots across tropical Asia, particularly in regions where agricultural expansion dominates.
4. Conclusion
Between 2000 and 2025, Võ Nhai District lost over 23,000 ha of forest (–30.7%), mainly due to agricultural expansion and accessibility pressures, consistent with Global Forest Watch (2024), which reported Võ Nhai as the province’s leading hotspot of forest loss. LandTrendr analysis revealed clustered disturbance events, consistent with Hansen et al. (2013) and Global Forest Watch (2024), which reported Võ Nhai as the province’s leading hotspot of forest loss. CA–Markov projections indicate a further 17,600 ha decline by 2050, with the greatest impacts in lowland communes.
These results confirm that land cover change is driven largely by cropland expansion and human activities. Sustaining Võ Nhai’s forests will require stronger land-use controls, community engagement, and continued satellite-based monitoring to guide conservation and development policies.
Funding: This work was financially supported by Vietnam Ministry of Education and Training under project number: B2024-TNA-15 and Thai Nguyen University of Agriculture and Forestry under project number: T2026-22.GV.
Acknowledgements
This work was financially supported by the Vietnam Ministry of Education and Training under project number B2024-TNA-15 and and Thai Nguyen University of Agriculture and Forestry under project number: T2026-22.GV. The authors also gratefully acknowledge the Faculty of Resource Management, the STAS_lab, and AEP office, Thai Nguyen University of Agriculture and Forestry, for their support and contributions to this research.
References
Belgiu, M., & Drăguţ, L. (2016). Random forest in remote sensing: A review of applications and future directions.
ISPRS Journal of Photogrammetry and Remote Sensing, 114, 24–31. https://doi.org/10.1016/j.isprsjprs.2016.01.011
Cochard, R., Ngo, D. T., Waeber, P. O., & Kull, C. A. (2020). Extent and drivers of forest cover changes in Vietnam’s provinces 1993–2013: A review and analysis. Regional Environmental Change, 20(1), 1–17. https://doi.org/10.1007/s10113-020-01628-4
Curtis, P. G., Slay, C. M., Harris, N. L., Tyukavina, A., & Hansen, M. C. (2018). Classifying drivers of global forest loss. Science, 361(6407), 1108–1111. https://doi.org/10.1126/science.aau3445
de Jong, W., Sam, D. D., & Hung, T. V. (2006). Forest rehabilitation in Vietnam: Histories, realities and future. CIFOR.
Food and Agriculture Organization (FAO). (2001). Global forest resources assessment 2000. FAO.
Food and Agriculture Organization (FAO). (2020). Global forest resources assessment 2020. FAO. https://doi.org/10.4060/ca9825en
Friedl, Mark A., and Carla E. Brodley. Decision tree classification of land cover from remotely sensed data. Remote sensing of environment 61, no. 3 (1997): 399-409.
Global Forest Watch. (2024). Tree cover loss in Thái Nguyên, Vietnam. Retrieved from https://www.globalforestwatch.org
Hansen, M. C., Potapov, P. V., Moore, R., Hancher, M., Turubanova, S. A., Tyukavina, A., ... & Townshend, J. R. G. (2013). High-resolution global maps of 21st-century forest cover change. Science, 342(6160), 850–853. https://doi.org/10.1126/science.1244693
Kennedy, R. E., Yang, Z., & Cohen, W. B. (2010). Detecting trends in forest disturbance and recovery using yearly Landsat time series: 1. LandTrendr—Temporal segmentation algorithms. Remote Sensing of Environment, 114(12), 2897–2910. https://doi.org/10.1016/j.rse.2010.07.008
Kennedy, R. E., Yang, Z., Cohen, W. B., & Pfaff, E. (2018). Implementation of the LandTrendr algorithm on Google Earth Engine. Remote Sensing, 10(5), 691. https://doi.org/10.3390/rs10050691
Ma, T., Sun, Z., Liu, W., & Yang, K. (2023). Global patterns and drivers of forest loss: A review of the last two decades. Environmental Research Letters, 18(7), 073004. https://doi.org/10.1088/1748-9326/acd2ef
Mountrakis, G., Im, J., & Ogole, C. (2011). Support vector machines in remote sensing: A review. ISPRS journal of photogrammetry and remote sensing, 66(3), 247-259.
McElwee, P. (2016). Forests are gold: Trees, people, and environmental rule in Vietnam. University of Washington Press.
Meyfroidt, P., & Lambin, E. F. (2008). Forest transition in Vietnam and its environmental impacts. Global Change Biology, 14(6), 1319–1336. https://doi.org/10.1111/j.1365-2486.2008.01575.x
Ministry of Natural Resources and Environment (MONRE). (2020). Vietnam national report on biodiversity and ecosystem services. Hanoi: MONRE.
Pal, M., & Mather, P. M. (2003). An assessment of the effectiveness of decision tree methods for land cover classification. Remote sensing of environment, 86(4), 554-565.
People’s Committee of Võ Nhai District. (2025). Explanatory report on the 2025 land use plan of Võ Nhai District. Võ Nhai District.
Pham, T. T., Bennett, K., Vu, T. P., Brunner, J., Le, N. D., & Nguyen, D. T. (2013). Payments for forest environmental services in Vietnam: From policy to practice. Occasional Paper 93. CIFOR.
Sikor, T. (2001). The allocation of forestry land in Vietnam: Did it cause the expansion of forests in the northwest? Forest Policy and Economics, 2(1), 1–11. https://doi.org/10.1016/S1389-9341(00)00041-1
Sang, L., Zhang, C., Yang, J., Zhu, D., & Yun, W. (2011). Simulation of land use spatial pattern of towns and villages based on CA–Markov model. Mathematical and Computer Modelling, 54(3–4), 938–943.
https://doi.org/10.1016/j.mcm.2010.11.019
Zhu, Z., & Woodcock, C. E. (2014). Continuous change detection and classification of land cover using all available Landsat data. Remote Sensing of Environment, 144, 152–171. https://doi.org/10.1016/j.rse.2014.01.011
Machaya Tafadzwa Milton¹, Dang Van Minh2, Nguyen Ngoc Anh2, Chu Van Trung2*
1 Advanced Education Program (AEP), Thai Nguyen University of Agriculture and Forestry, Thai Nguyen, Vietnam
2 Faculty of Natural Resources Management, Thai Nguyen University of Agriculture and Forestry, Thai Nguyen, Vietnam